







Data-driven recruiting
The indicators and metrics that predict an audition's success

In this article
Beyond gut feeling: deciding with numbers
"The audition went well" or "we had few candidates" are subjective assessments. They do not say why things went a certain way, nor how to do better next time. They are the report of an impression, not the start of a strategy.
Data-driven recruiting replaces impressions with concrete numbers: it analyses what worked, what did not and — above all — lets you correct course while the campaign is still running. dbStrings provides a statistics report at the end of every promotion; knowing how to read it is what turns information into decisions.
The key indicators
Four numbers tell almost everything about a campaign. Learning to read them together — not in isolation — is half the work.
The four indicators
- Listing views: how many people saw the announcement. Below 500 the news is not circulating; 500-1,500 is the norm; over 1,500 the distribution works.
- Call downloads: how many showed concrete interest. The downloads/views ratio measures the quality of communication: below 10% something is off-putting, 15-25% is healthy, over 30% the call is very attractive.
- Clicks to the official page: how many dig deeper about the orchestra. Those who visit the site are more likely to apply; few clicks may mean a call that is already complete (good) or an institution that fails to intrigue (bad).
- Geographic origin: where potential candidates come from. A concentrated distribution (e.g. 80% one country) signals you are not reaching the international market; a broad one, that promotion works globally.
The predictive indicators
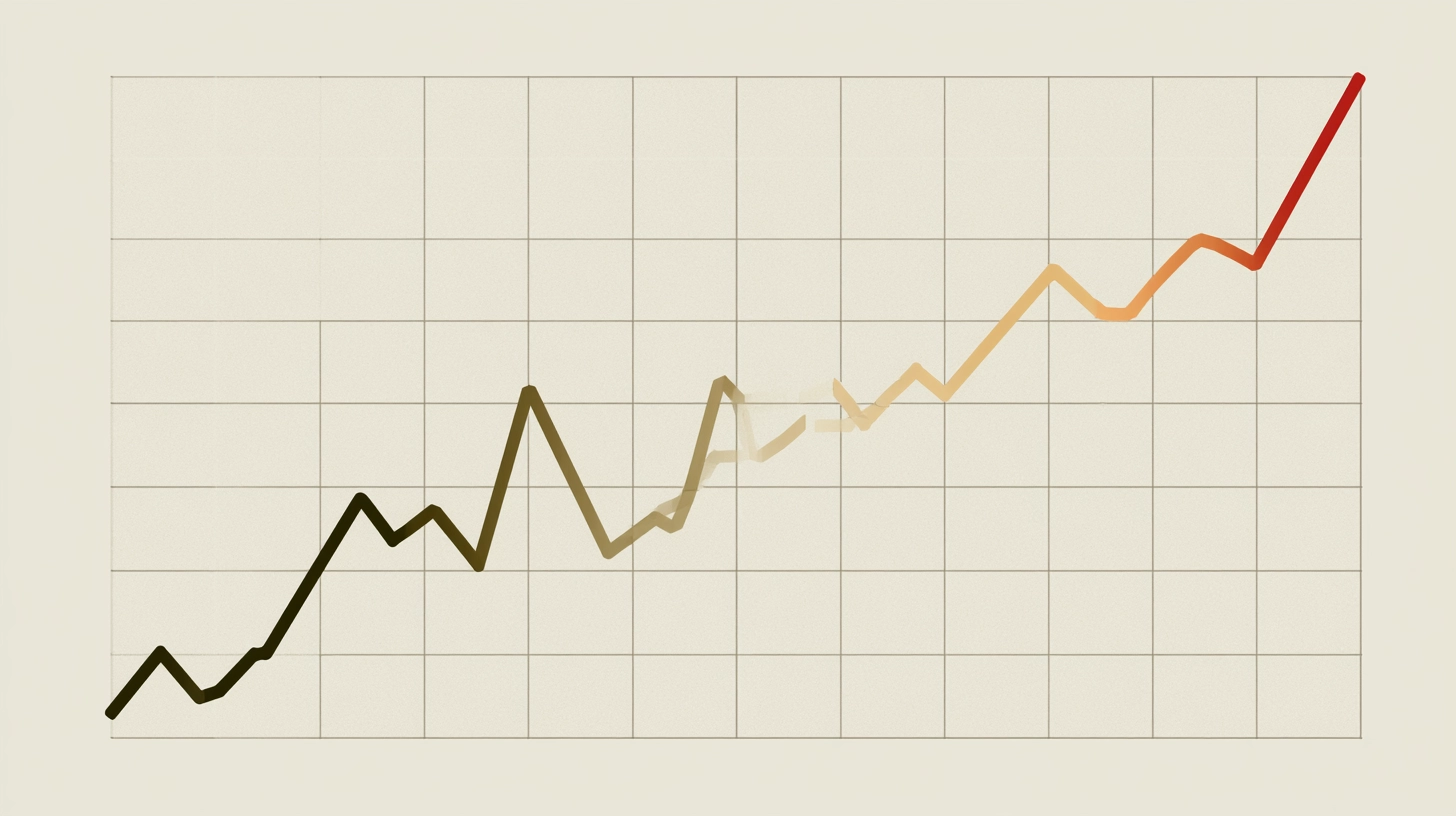
Some numbers let you predict the outcome while the campaign is still open — and so intervene in time instead of noting the failure at the end.
The speed of accumulation of views is the first signal: in the first three days the curve must take off, and the first week should gather 40-50% of the total; the last 48 hours bring the peak of last-minute deciders. The views/time-remaining ratio is the second: at mid-campaign, if you are at 30% of the target with 50% of the time gone, the trajectory is not good. The third is the comparison with previous auditions: if you already have a track record for the same instrument, significant deviations signal a change in the market or in communication. In every case the rule is one: if the first week is below expectations, intervene at once with an ADVplus, not once the campaign is over.
Case study: reading a report
Section-double-bass audition, a six-week campaign. Here are the report's headline figures.
The origin was spread out — Italy 31%, Germany 18%, USA 15%, others 36% — a crucial fact for the double bass, where local candidates are scarce. The interpretation is clear: the campaign worked. The broad international distribution reached the right market, the download rate within norm confirms the call was adequate, and the 23 applications — above the average for the double bass — led the panel to find a suitable candidate. The numbers did not just describe the result: they had already foreshadowed it halfway through.
When the data signals problems
The most useful reports are the bad ones, because they say exactly where to intervene. Three recurring scenarios, with their diagnosis.
Three warning scenarios
- High views, few downloads (e.g. 2,100 views, 95 downloads = 4.5%): many see, few dig deeper. The problem is in the call — requirements too strict, unclear conditions, missing information. Action: revise the text, add details on contract and pay, drop non-essential requirements.
- Few views, high download rate (e.g. 380 views, 89 downloads = 23%): those who see are interested, but too few see. It is a distribution problem, not a communication one. Action: immediate ADVplus and check that the sharing in the groups happened.
- Origin too concentrated (e.g. 85% one country for a principal): you are not reaching international candidates, often the most qualified for senior roles. Action: check the call is in English, consider an internationally focused ADVplus and watch overlaps with other auditions.
Building a track record
The value of data grows over time. After 10-15 auditions the orchestra has internal benchmarks — average views per instrument, typical download rate, expected geographic spread, the correlation between metrics and actual applications — that make spotting an anomaly immediate.
The practical tip is simple: keep a spreadsheet with one row per audition and a few columns (instrument, type of position, duration, views, downloads, clicks, top-5 origin, applications, outcome). After a year, the patterns emerge on their own, and every new campaign starts from a basis of comparison rather than from scratch.
The limits of data
Numbers are a tool for deciding better, not an oracle. They must be read alongside knowledge of the market and experience, because on their own they do not say everything.
What the data does not say
- Views do not distinguish the curious from serious candidates.
- Downloads do not guarantee applications.
- Origin indicates interest, not quality.
- External factors (other simultaneous auditions, time of year) influence results.
Operational conclusion
Data-driven recruiting is a cycle: gather the numbers of every campaign, interpret the key indicators, compare them with your own track record, intervene during the campaign if corrections are needed, and document everything for next time. No step requires technical skills: it requires the habit of looking at the numbers before trusting your gut.
Orchestras that analyse the data of their own auditions improve time after time. Those that do not repeat the same mistakes.
